Search This Blog

Wednesday 25 June 2014

Export to Excel in Microsoft Dynamics AX 2012

Below is the sample code snippet to export the data from Microsoft Dynamics AX to Excel.

Example no 1:

            SysExcelWorkbooks workbooks;
            SysExcelWorkbook workbook;
            SysExcelWorksheets worksheets;
            SysExcelWorksheet worksheet;
            SysExcelCells cells;
            SysExcelCell cell;
   
            application = SysExcelApplication::construct();
            workbooks = application.workbooks();
            workbook = workbooks.add();
            worksheets = workbook.worksheets();
            worksheet = worksheets.itemFromNum(1);
            cells = worksheet.cells();
           
            cell = cells.item(row, col);
       
            cell.value("sample Code");
           
            worksheet.columns().autoFit(); //use to autofit the columns of the excel sheet
       
            application.visible(true);

IF you want to print some Headings in Bold format and in more than one cell:

Example No 2:

             fontSizeRange   = #B+int2str(2)+","+#C+int2str(2);
             mergeCellsRange = #B+int2str(2)+":"+#C+int2str(2);
       
             this.insertValue(row,col,"Project Comparison Budget VS               Actual",true,fontSizeRange,13,true,mergeCellsRange,false,0);
           
             public void insertValue(int         _row,
                                int         _col,
                                anytype     _value,
                               boolean     _isFontBold = false,
                                str         _fontSizeRange = "",
                                int         _fontSizeWeight = 11,
                                boolean     _isMergeCell = false,
                                str         _mergeRange = "",
                                boolean     _allignment  = false,
                                int         _allignmentType = #xlLeft)
            {
       
                cell = this.parmCells().item(_row, _col);
                cell.value(_value);
       
                if (_isFontBold)
                {
                    font = cell.font();
                    font.bold(_isFontBold);
                }
                if (_fontSizeRange != "")
                {
                    worksheetCOM    = this.parmWorksheet().comObject();
                    rangeCOM        = worksheetCOM.Range(_fontSizeRange);
                    fontCOM         = rangeCOM.Font();
                    fontCOM.Size(_fontSizeWeight);
                }
                if (_isMergeCell)
                {
                    range = this.parmCells().range(_mergeRange);
                    range.comObject().MergeCells(1);
                }
                if (_allignment)
                {
                    if (_isMergeCell)
                    {
                        range.horizontalAlignment(_allignmentType);
                    }
                    else
                    {
                        cellCOM =  cell.comObject();
                        range = this.parmCells().range(cellCOM.address()+":"+cellCOM.address());
                        range.horizontalAlignment(_allignmentType);
                    }
                }
            }

This was all related to the export to excel.

If you have any query related to export to excel than feel free to comment.


Thanks

Muhammad Zahid


SSRS Reports Range Bar Chart Show Start and End Date Only

Below are the steps to show the start and end date only in a range bar chart in SSRS reports.

First of all just select the Horizontal Axis of the chart as you can see this in the below image.


Now right click this horizontal axis and than select axis properties.

A new window will open select the first tab i.e Axis Options.As you can see this window in the below image.


As you can see in the above image in the minimum text box select the startdate and in the maximum text box select the end date and in the interval write the expression i.e

=datediff("d", Fields!PSASchedStart.Value, Fields!PSASchedEnd.Value)

after that click ok and than save the report.

After running the report you will see that you can only see the start and end dates in the range bar chart as you can see in the below image.


This was all related to the range bar chart showing the start and end date only.

Below is the link for more information

http://stackoverflow.com/questions/18004792/ssrs-chart-x-axis-show-start-and-end-date-only

If you have any issues feel free to comment on this.

Thanks

Muhammad Zahid.

SSRS Reports Hide Duplicate Records and White Spaces

Some times while working on SSRS reports there are some duplicate records issue occurs.

Like you can see this in the below image.


Now to remove the duplicate records just right click the table and than select properties and than set the hidden property to:

=Fields!ActivityNumber.Value = Previous(Fields!ActivityNumber.value)

AS you can see the property in the below image:


Now after setting this property the data on the report looks like this:


In the above image the duplicate  record is hidden but the issue is that there are some white spaces left between the rows.

Two resolve this issue we have to remove the expression from the hidden property of the table.
And than  select the row and than right click select row group and than select the group properties as you can see this in the below image


After selecting the group properties now select  select visibility and than add the expression that we have added above in the hidden property i.e

=Fields!ActivityNumber.Value = Previous(Fields!ActivityNumber.value)

As you can see this in the below image.


Now after doing that the duplicate records will be remove and also the white spaces between the rows will be remove as you can see that in the below image.


The above example that I have given is related to hiding row based on single column.If you want to hide the records based on two or more columns that you can use the below expression.

=(Fields!Voucher.Value = Previous(Fields!Voucher.Value)) And (Fields!AccountNum.Value = Previous(Fields!AccountNum.Value))

The above expression means that if the voucher and the AccountNum both are repeating than report short hide the row.

This was all related to the duplicate records and white spaces.
Below are some more links related to this.

http://glutenfreesql.wordpress.com/2012/10/02/ssrs-hide-duplicates/

http://stackoverflow.com/questions/11562043/trying-to-get-rid-of-white-space-in-ssrs-report

http://dba.stackexchange.com/questions/53727/how-to-hide-rows-in-ssrs-report


If you have any questions related to that than feel free to comment on this.


Thanks

Muhammad Zahid.

Tuesday 3 June 2014

Microsoft Dynamics AX 2012: Uploading data from Excel into our Dynamics Ax table.


In that post I will show you example on how can we import data from excel and than map it on your AX table.

I have created an excel sheet in which I have added some data as you can see this in the image below.

After that I will import that the data into my AX table.


The staging table that I have created on which I will map the Excel data can be seen in the below image.


Now I will show you the process of Importing this Data into our AX tables.

I have just created a class.In the main method of that class I am calling another method and passing path of my excel sheet as a parameter.

You can see that method in the below image.


Now inside the method ImportData() there is a process written which gets the data from excel cells and than map them into the Ax tables.

You can see the code snippet for that method below.

public void ImportData
(Filename _fileName)
{
    SysExcelApplication     application;
    SysExcelWorkbooks       workbooks;
    SysExcelWorkbook        workbook;
    SysExcelWorksheets      worksheets;
    SysExcelWorksheet       worksheet;
    SysExcelCells           cells;
    COMVariantType          type;
    int                     row ;
    Zahidtable lineImport;
    str offsetType;
    str account;
    str offsetAccount;
    str transactionType;

    application = SysExcelApplication::construct();
    workbooks = application.workbooks();


    try
    {
        workbooks.open(_fileName,0,true);
    }
    catch (Exception::Error)
    {
        throw error('@SYS19358');
    }

    workbook = workbooks.item(1);
    worksheets = workbook.worksheets();
    worksheet = worksheets.itemFromNum(1);
    cells = worksheet.cells();

    row = 2;

    lineImport.clear();

    startLengthyOperation();
    do
    {
        row++;

        try
        {
            lineImport.clear();

            transactionType = this.VarientConversionMethod(cells.item(row, 8).value());

            //For acquisition
            if(transactionType == "Acquisition")
            {
                lineImport.TransType = AssetTransTypeJournal::Acquisition;
                account = this.VarientConversionMethod(cells.item(row, 1).value());
                lineImport.Account = account;
                lineImport.LedgerDimension =       AxdDimensionUtil::getMultiTypeDefaultAccountId(129,                LedgerJournalACType::FixedAssets, [account]);
                lineImport.txt = this.VarientConversionMethod(cells.item(row ,2).value());
                lineImport.AmountCurDebit = this.VarientConversionMethod(cells.item(row, 3).value());
                offsetType = this.VarientConversionMethod(cells.item(row, 4).value());
                offsetAccount = this.VarientConversionMethod(cells.item(row, 5).value());
                lineImport.BookId = this.VarientConversionMethod(cells.item(row, 6).value());
                lineImport.AssetBookId = this.VarientConversionMethod(cells.item(row, 7).value());
            }

            if (offsetType == "ledger")
            {
                lineImport.OffsetAccountType = LedgerJournalACType::Ledger;
                lineImport.OffsetLedgerDimension = AxdDimensionUtil::getLedgerAccountId( [offsetAccount, offsetAccount, 0]);
            }

            ttsBegin;
            lineImport.insert();
            ttsCommit;

        }
        catch(Exception::Error)
        {
            info("Error found while importing data from excel");
        }

        type = cells.item(row+1, 1).value().variantType();
    }
    while (type != COMVariantType::VT_EMPTY);

    endLengthyOperation();

}


In the above code. I am basically calling another method i.e VarientConversionMethod(COMVariant _varientValue).

In that method  I am going to type cast the values that I have fetched from the excel based on the fields on the table.

You can see the code of  that method below.

private anytype VarientConversionMethod(COMVariant _varientValue)
{
    str value;
    real value2;
    switch(_varientValue.variantType())
    {
        case COMVariantType::VT_BSTR:
            value = strFmt("%1", _varientValue.bStr());
            break;
        case COMVariantType::VT_DECIMAL, COMVariantType::VT_R4, COMVariantType::VT_R8:
            value = strFmt("%1",_varientValue.double());
            value2 = System.Convert::ToDecimal(value);
            value = System.Convert::ToString(value2);
            if (Global::numOfDec(_varientValue.double()) == 0)
            {
                value = strFmt("%1",real2int(_varientValue.double()));
            }
            break;
        case COMVariantType::VT_I1, COMVariantType::VT_I2, COMVariantType::VT_I4:
            value = strFmt("%1",_varientValue.int());
            break;
        case COMVariantType::VT_UI1, COMVariantType::VT_UI2, COMVariantType::VT_UI4:
            value = strFmt("%1",_varientValue.uLong());
            break;

        case COMVariantType::VT_DATE:
            value = strFmt("%1",_varientValue.date());
            break;
         case COMVariantType::VT_EMPTY:
            value = '';
            break;
        default:
            throw error(strfmt('Unhandled variant type (%1).', _varientValue.variantType()));
    }

    return value;
}

Now I have run that class and I am successfully able to the record inside my table.

You can see the record inside my staging table in the below image.


This was all related to uploading the Data from Excel into our Microsoft Dynamics AX table.

I hope you like that post.

Thanks

Muhammad Zahid.

Thursday 29 May 2014

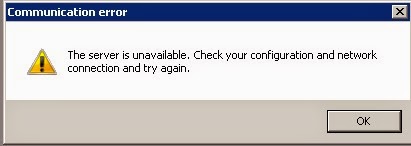
The Server is unavailable.Check your configuration and network connection and try again.


Some time when we try to open the AX this error message appears.

The reason for this error message is that AOS service is not started on your machine.

Just go to start menu and than search for the services.msc file and than open it and than find Microsoft Dynamics AX object server and right click it and than select start.

As you can see the image of this in the below image.


Some times this Dynamics AX object server didnt find in  services.msc file.This is due to the reason that service may be hosted on some other machine.

To check on which machine AOS service is installed you can go to the Microsoft Dynamics AX configuration and than select the connection tab you will see the name of the machine on which AOS service is running.

You can see this in the below image.


This was all related to this error message.I hope it will help in resolving the issue.

If you have any issue feel free to comment on this.

Thanks

Muhammad Zahid

Monday 28 April 2014

AOT Maps in Microsoft Dynamics AX 2012

Maps are basically use to wrap the tables on run time.Some times there are some cases in which the structure of two or more tables is same with difference in their field names.In these kind of cases the field.

The fields of the maps are basically use to map fields of one or more tables.By the help of a maps we can access the fields of one or more tables with different names.

Steps of Creating the Maps:

For showing the implementation of table maps I have just created the two tables.As you can see them  in the below image.


After that I will create the map on which I will map the fields of the above tables.

Just go to the Data Dictionary -> Maps right click and than select new map.


Now add fields to this map.As you can see them in the below image.


Now right click the mapping node and than select the new mapping and than set the name of the table on which you want to map.

As you can see this in the below image.


Now right click the fields inside that mapping and then set them to the fields of the table on which you are mapping.As you can see this in the below image.


Now I have created a job on which I will map a table on this map and than use it.

You can see that job in the below image.


In the above table I have map the studentA table to our map i,e studentcourse at run time and than I have set the fields of that map and than insert them.As you already know that in the above code the studentA table is already mapped to our map that is why after the insert call the data will insert into the studentA table.

My the help of Maps you can perform any operation you want as you do on table.

This was all related to the AOT Maps.

Below are some useful links related to AOT maps.

http://ajstudi0.blogspot.com/2012/10/microsoft-dynamics-ax-maps.html

http://msdn.microsoft.com/en-us/library/bb278211.aspx 


Friday 21 March 2014

Precision Design In SSRS Reports.

I have developed a simple SSRS report using the Precision Design want to share some properties in it.

Below is the image of simple report I have made  using the precision design.


As you can see in the above report that I am showing the total amount against each budget purpose type.

To do this just right click the row and than select the parent group as you can see this in the below image.


After that a new window will open where you have to select the column on which we have to apply the group and also we can select to add the footer row below if we want to show the total.


After doing that a new column will be created.you can delete that if you don't want it.This column is basically showing the field on which we have applied the group by.As you can see this in the below image.


I have deleted that Column.After that on the footer row I am calculating the sum of the amount.I have also added one more column on which I have put some text.

As you can see this in the below image.


Now you can see in the above images there is a background colour and borders around the cells you can do this just by right click the cell and than  select the table box property as you can see this in the below image.


After that a new window will open where you can select the border node to set the border of the of the cell as you can see this in the below image.


After select the fill node to set the background colour of the cell.As you can see this in the below image.


In the above image you can also see the alignment option to set the alignment of the cell.

You can also set the border and background color of the all the cells in single just by selecting all the cells and than right click and than select the properties.

As you can see this in the below image.


These are some simple tips related to precision desing in SSRS reporting.

I hope you like it.If you have any question related to them than feel free to comment.

Thanks

Muhammad Zahid.